



In search engine optimization, marketing teams spend an extraordinary amount of time staring at position trackers. When a target keyword moves from position four to position two, teams celebrate; when it slides to position seven, emergency meetings are called to overhaul page titles, disavow backlinks, or rewrite entire introductions. This reactive cycle is one of the most common—and costly—mistakes in digital marketing.
Keyword rankings are, by definition, lagging indicators. By the time a URL visibly gains or loses ground in Google's search results, the underlying factors that caused that movement—algorithmic evaluations, crawl accessibility, content freshness, internal link equity, and user engagement signals—shifted weeks or even months earlier. Reacting exclusively to ranking fluctuations is like driving a car while looking solely in the rearview mirror: you only discover where you are heading after the turn has already occurred.
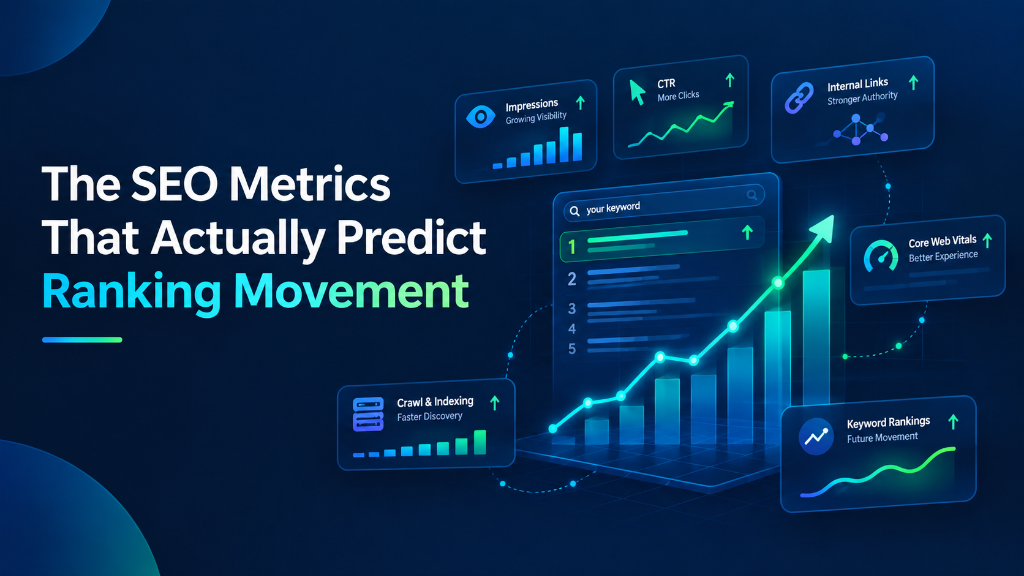
To manage search performance with predictive discipline rather than reactive panic, teams must monitor leading indicators. Leading metrics reveal how search engine crawlers and ranking algorithms are responding to your website long before those changes crystallize into final SERP positions or revenue. This guide examines why daily rank tracking misleads decision-makers, identifies the specific leading metrics that genuinely forecast ranking movement, and provides an actionable diagnostic framework for monitoring them.
Why Daily Rank Tracking Misleads Marketing Teams
Rank tracking software checks search results by querying search engines from automated server environments across multiple geographies. While tracking keyword positions is useful for measuring broad historical progress, relying on daily ranking snapshots to judge the health of your SEO strategy introduces significant operational risk.
Modern Search Engine Result Pages (SERPs) are inherently dynamic. Fluctuations of three to five positions day-to-day frequently have nothing to do with algorithmic penalties or content deficiencies. They are driven by:
- Algorithmic Testing and Query Shuffling: Search engines continuously test alternative documents on small cohorts of searchers to measure comparative satisfaction and user engagement.
- Localization and Personalization: Search results vary significantly based on the searcher's physical location, device category, browsing history, and language preferences.
- Dynamic SERP Features: The insertion or displacement of Featured Snippets, AI Overviews, People Also Ask blocks, Local Packs, and video carousels dynamically shifts organic positions up or down the page without any change to the underlying document's evaluation.
- Competitor Fluctuations: Temporary ranking gains can occur simply because a competitor experienced a site outage or bad deployment, creating a temporary vacuum that disappears once their issue is resolved.
When teams treat these normal daily variations as meaningful signals, they make hasty adjustments—modifying title tags, changing URL structures, or rewriting sections that were actually performing well. Each significant change forces search engines to re-evaluate the document from scratch, resetting the observation window and causing further instability.
Leading Metric 1: Search Console Impression Velocity for Latent Query Clusters
When Google's algorithms begin evaluating a page as authoritatively relevant to a topic, they rarely place it directly at the top of competitive search queries. Instead, the page begins appearing for dozens, hundreds, or thousands of related long-tail, semantic, and synonymous variations at lower positions (typically positions 15 through 50).
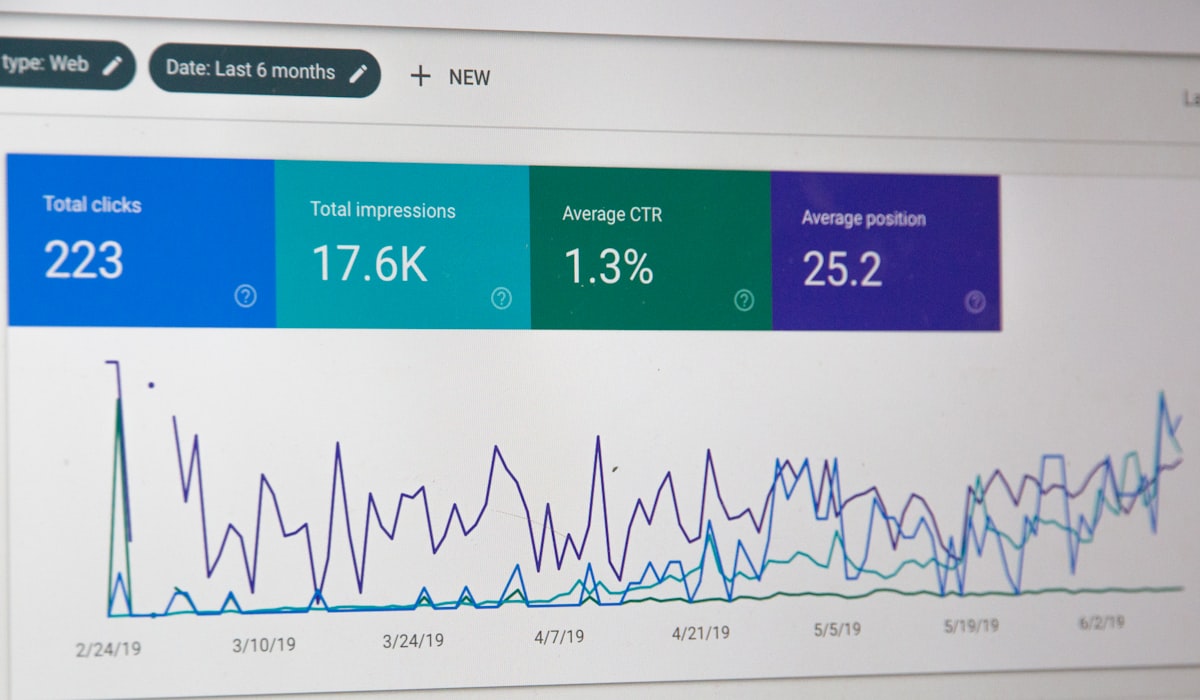
Because search impressions are recorded whenever a URL appears in a user's search result—regardless of whether the user scrolls down to see it—an expansion in total query count and impression volume is the earliest statistical signal of growing algorithmic trust. Google Search Console Help — Performance Report for Search
In fact, a common leading indicator of a future ranking breakout is a scenario where impressions surge while average position temporarily declines. When an article that previously ranked only for five specific queries suddenly qualifies to appear for four hundred broader variations, those new lower-ranking appearances drag down the mathematical average position. Novice analysts panic at the declining average position; experienced search marketers recognize that the expanded footprint indicates Google is actively testing the page across an expanded topical cluster.
Leading Metric 2: Googlebot Crawl Frequency and Response Health
Search begins with crawling. Before a search engine can index, evaluate, or rank content, it must retrieve it. Google's allocation of crawl resources—often referred to as crawl budget—is heavily influenced by two factors: how fast your server responds, and how valuable Google deems your content to be.
Monitoring Googlebot activity through Google Search Console's Crawl Stats report provides critical early-warning data regarding technical health and search engine interest: Google Search Console Help — Crawl Stats Report
| Crawl Metric | What It Measures | What a Shift Predicts |
|---|---|---|
| Average Response Time (TTFB) | Server latency in milliseconds required to deliver requested HTML to Googlebot. | A sharp increase in server response time forces Googlebot to throttle crawl rate to avoid overloading your server, leading to delayed indexation and stagnant rankings. |
| Total Crawl Requests | The raw volume of page requests made by Googlebot over time. | A sustained increase indicates Google perceives high site freshness and value. A sudden decline often precedes ranking drops across dynamic catalog pages. |
| HTTP Status Breakdown | Distribution of response codes (200 OK, 301 Redirect, 404 Not Found, 5xx Server Error). | A rising proportion of 5xx server errors or 404 broken links signals infrastructural instability, triggering algorithmic demotion if unaddressed. |
If a website's server response time degrades or Googlebot's crawl requests drop by 50% over two weeks, rankings will not plummet tomorrow. However, that technical friction almost guarantees that ranking momentum will stall within the subsequent 30 to 60 days.
Leading Metric 3: The Indexing Transition Ratio
Getting a URL crawled does not guarantee it will be added to the search index. Google Search Console's Page Indexing report categorizes unindexed pages into specific technical states. Tracking the movement of URLs between these states is one of the most reliable leading indicators of site-wide quality evaluation: Google Search Console Help — Page Indexing Report
- Discovered — currently not indexed: Google found the URL (via sitemap or internal link) but has not yet crawled it. If this number spikes, your site has a crawl priority or server capacity constraint.
- Crawled — currently not indexed: Googlebot retrieved and rendered the page, examined its content, and explicitly decided not to include it in the search index.
The ratio of Crawled — currently not indexed URLs is an essential early-warning metric. When this status increases across a specific page template (such as blog posts, programmatic landing pages, or product categories), it indicates that Google has evaluated that template as thin, repetitive, or low-value. When a template's indexing ratio drops, existing indexed pages built on that same template are frequently downgraded in search rankings several weeks later.
Leading Metric 4: Query-Specific Click-Through Rate Relative to Position Benchmarks
Click-Through Rate (CTR) is commonly treated merely as a traffic calculation, but it functions as a critical indicator of search snippet relevance and user intent alignment. Search engines continuously evaluate whether the titles, meta descriptions, and structured snippets displayed in search results satisfy the query that prompted them.
Rather than evaluating raw CTR in isolation, evaluate CTR relative to position benchmarks. While click-through distributions vary based on SERP layout and intent type, historical search benchmarks establish expected baseline ranges:
| Organic Position | Expected Non-Branded CTR Range | Diagnostic Warning Threshold |
|---|---|---|
| Position 1 | 20% to 30% | CTR below 12% indicates poor snippet appeal or heavy displacement by ads and SERP features. |
| Position 2 | 10% to 16% | CTR below 7% indicates meta title fails to communicate unique value. |
| Position 3 | 6% to 10% | CTR below 4% indicates misalignment with search intent. |
| Positions 4 to 10 | 1.5% to 5% | CTR below 1% indicates snippet is completely ignored by searchers. |
When a page holds a top-four ranking but consistently generates a click-through rate substantially below the expected benchmark, it indicates that searchers are bypassing your result in favor of competitors. Over time, search algorithms detect this persistent lack of engagement and re-rank the SERP to elevate listings that better satisfy user intent.
Leading Metric 5: Real-World Experience Signals (Core Web Vitals)
Google has been explicit in its official documentation: page experience signals do not override content relevance. An exceptionally fast page that fails to answer a user's question will never outrank an authoritative, comprehensive page. However, Core Web Vitals function as an essential operational prerequisite and competitive tiebreaker. Google Search Central — Understanding Page Experience
Core Web Vitals measure real-world user experience across three foundational dimensions codified by Web.dev and the W3C: Web.dev — Web Vitals Overview
- Largest Contentful Paint (LCP): Measures loading performance. Target: under 2.5 seconds for at least 75% of page visits.
- Interaction to Next Paint (INP): Measures page responsiveness to user interactions. Target: under 200 milliseconds.
- Cumulative Layout Shift (CLS): Measures visual stability during render. Target: score below 0.1.
When a website undergoes a frontend redesign or introduces heavy client-side JavaScript tracking that degrades INP or LCP into 'Poor' territory, search rankings do not disappear overnight. Instead, the degradation acts as an ongoing drag on crawl efficiency and user satisfaction. When combined with declining on-page engagement, poor Core Web Vitals reliably forecast competitive erosion over subsequent quarters.
Leading Metric 6: Internal Link Equity and Anchor Density
While external backlinks receive the majority of industry attention, internal linking architecture is often the most direct internal predictor of ranking changes. Search engines rely heavily on internal links to understand the hierarchical importance, contextual relevance, and semantic relationships between pages on your domain.
During website redesigns, CMS migrations, or catalog updates, pages frequently lose critical internal links without anyone noticing. A high-priority resource that was previously linked from the primary navigation, sidebar widgets, or related-article modules might be relegated to pagination archives. When a page's incoming internal link count drops significantly, search engine crawlers reduce their visit frequency, and the page loses internal PageRank equity. Ranking slides almost invariably follow within four to eight weeks.
Two Hypothetical Scenarios: Leading vs. Lagging Indicators
To understand how these predictive signals operate in practice, consider two contrasting hypothetical project scenarios.
Hypothetical Scenario A: The Silent Slump (B2B SaaS Pricing Guide)
The Situation: A B2B software company published a comprehensive pricing comparison guide that held stable at Position 4 for its primary target keyword for six months.
The Hidden Leading Signals:
- Over a four-week period, total search impressions across secondary long-tail queries dropped by 35%, even though the primary keyword position remained at Position 4.
- The page's click-through rate dropped from 7.2% to 3.8% because two competitors updated their meta titles to address newly released industry pricing models.
- Googlebot's crawl frequency to that specific URL fell from once every two days to once every eleven days.
The Outcome: The marketing team, relying solely on a daily rank tracker that still reported 'Position 4', made no adjustments. Six weeks later, during a routine search index update, the page abruptly dropped from Position 4 to Position 14, cutting organic traffic by 70%. By learning to monitor query impression breadth and CTR benchmarks, the team could have refreshed the snippet and updated the content weeks before the ranking collapsed.
Hypothetical Scenario B: The Bullish Breakout (E-Commerce Category Overhaul)
The Situation: An online home goods retailer overhauled its 'Ergonomic Office Chairs' category page, adding structured facet navigation, comprehensive buying guidance, and updated product schema.
The Early Leading Signals:
- In the first three weeks after launch, the primary keyword 'ergonomic office chairs' showed zero movement, hovering between Position 22 and Position 25.
- However, total Search Console impressions for the URL surged by 420%, as the page began ranking across hundreds of newly discovered long-tail queries ('best lumbar chair for small spaces', 'breathable mesh chair reviews').
- Googlebot crawl requests to the URL quadrupled, and server response time improved from 820ms to 240ms.
The Outcome: Stakeholders initially expressed disappointment that the primary keyword had not improved after three weeks. However, recognizing the surging impression volume and increased crawl frequency as leading indicators of algorithmic validation, the team stayed the course without making frantic edits. Over the following sixty days, the page steadily climbed into Position 2 for its primary keyword, quadrupling organic conversions.
A Predictive SEO Monitoring Cadence
To avoid getting overwhelmed by continuous metrics tracking, high-performing teams establish a structured monitoring cadence that separates operational leading indicators from long-term lagging outputs:
| Frequency | Leading Metric to Inspect | Primary Source | Action Trigger |
|---|---|---|---|
| Weekly | Impression velocity and query expansion on priority URLs. | Google Search Console (Performance Report) | Investigate any URL where impressions drop >25% while rankings appear stable. |
| Weekly | Crawl response latency and 5xx/4xx error spikes. | Search Console (Crawl Stats) & Server Access Logs | Address server bottlenecks if average TTFB exceeds 600ms or error rates rise. |
| Monthly | Indexing transition ratios (Crawled vs. Discovered vs. Indexed). | Google Search Console (Page Indexing Report) | Audit content quality if 'Crawled - currently not indexed' increases >15%. |
| Monthly | Query-level CTR relative to position benchmarks. | Google Search Console (Performance Report) | Rewrite titles and meta descriptions for pages with sub-benchmark CTRs. |
| Monthly | Internal link count changes on top-performing URLs. | Google Search Console (Links Report) & Site Crawlers | Restore internal links removed during recent content or navigation updates. |
| Quarterly | Core Web Vitals field performance (LCP, INP, CLS). | Search Console (Core Web Vitals) & PageSpeed Insights | Optimize assets and JavaScript execution if CrUX scores enter 'Needs Improvement'. |
Summary: Shifting From Reactive Panic to Predictive Discipline
Search engine optimization is an exercise in managing complex systems with incomplete information. Search engines do not publish exact real-time mathematical scores, nor do they guarantee that any specific action will result in a top ranking.
However, by shifting your team's focus from lagging rank positions to leading operational signals, you transform SEO from an unpredictable gamble into a disciplined, predictive engineering process:
- Do not panic over daily rank tracking: Recognize daily SERP fluctuations as normal variance, testing, and localization noise. Evaluate performance using rolling 28-day trends.
- Watch query impressions first: Expanding impressions across diverse query clusters is the earliest and most reliable sign that search algorithms view your content favorably.
- Maintain technical crawl health: Fast server response times and consistent Googlebot crawl frequency are essential prerequisites for long-term ranking stability.
- Monitor indexing status ratios: A growing volume of 'Crawled — currently not indexed' URLs is an urgent early warning of quality and duplication issues.
- Benchmark CTR to protect rankings: Pages that consistently underperform expected CTR benchmarks for their rank position will eventually be demoted in favor of more engaging results.
By monitoring what search engines and users do before positions change, digital teams can address emerging problems proactively, protect their organic visibility, and drive sustainable search growth.